Recently, I read Addy Osmani’s book Web Performance Engineering in the Age of AI. In the book, he notes that LLMs optimize for the correctness of the output as it relates to the prompt and not necessarily for the performance of the code they generate.
Anecdotally, I’ve noticed that LLM-produced code and agents are often more verbose than code written from scratch. In tandem with my work on this article, I’ve also had interesting discussions about this phenomenon in my network. This article takes an objective look at AI’s impact on the web at scale as these tools gain adoption and become more incorporated into the development process.
Data Source
This analysis uses data from the HTTPArchive, a public dataset with millions of records that is invaluable for analyzing trends in the web at scale. It has also been around long enough that it has enough information to set a baseline for the metrics before the adoption of AI.
I chose to focus on Page Weight and JavaScript Weight. If AI-generated code contributes to larger page weights, we would expect a steeper growth rate post-AI. Examining this correlation helps understand AI’s impact on web development. Monitoring JavaScript weight is particularly important because JS is the most computationally expensive asset byte-for-byte, and a disproportionate increase suggests a higher risk of performance regressions.
LLM Correlation
To correlate LLM usage with changes in page weight, I identified major milestones for the three key players in the AI space: Anthropic, ChatGPT, and Gemini. Using public release notes, I annotated the dataset to mark these inflection points. I’ve used the release of ChatGPT-3.5 in November 2022 as the beginning of the AI era for this exploration.
Releases
- November 2022: GPT-3.5
- March 2023: GPT-4
- July 2023: Claude 2.0
- November 2023: Claude 2.1
- March 2024: Claude 3
- May 2024: GPT-4o
- February 2025: Gemini 2.0 Pro
- March 2025: Gemini 2.5 Pro
- May 2025: Claude 4
- August 2025: GPT-5
- November 2025: Gemini 3 Pro
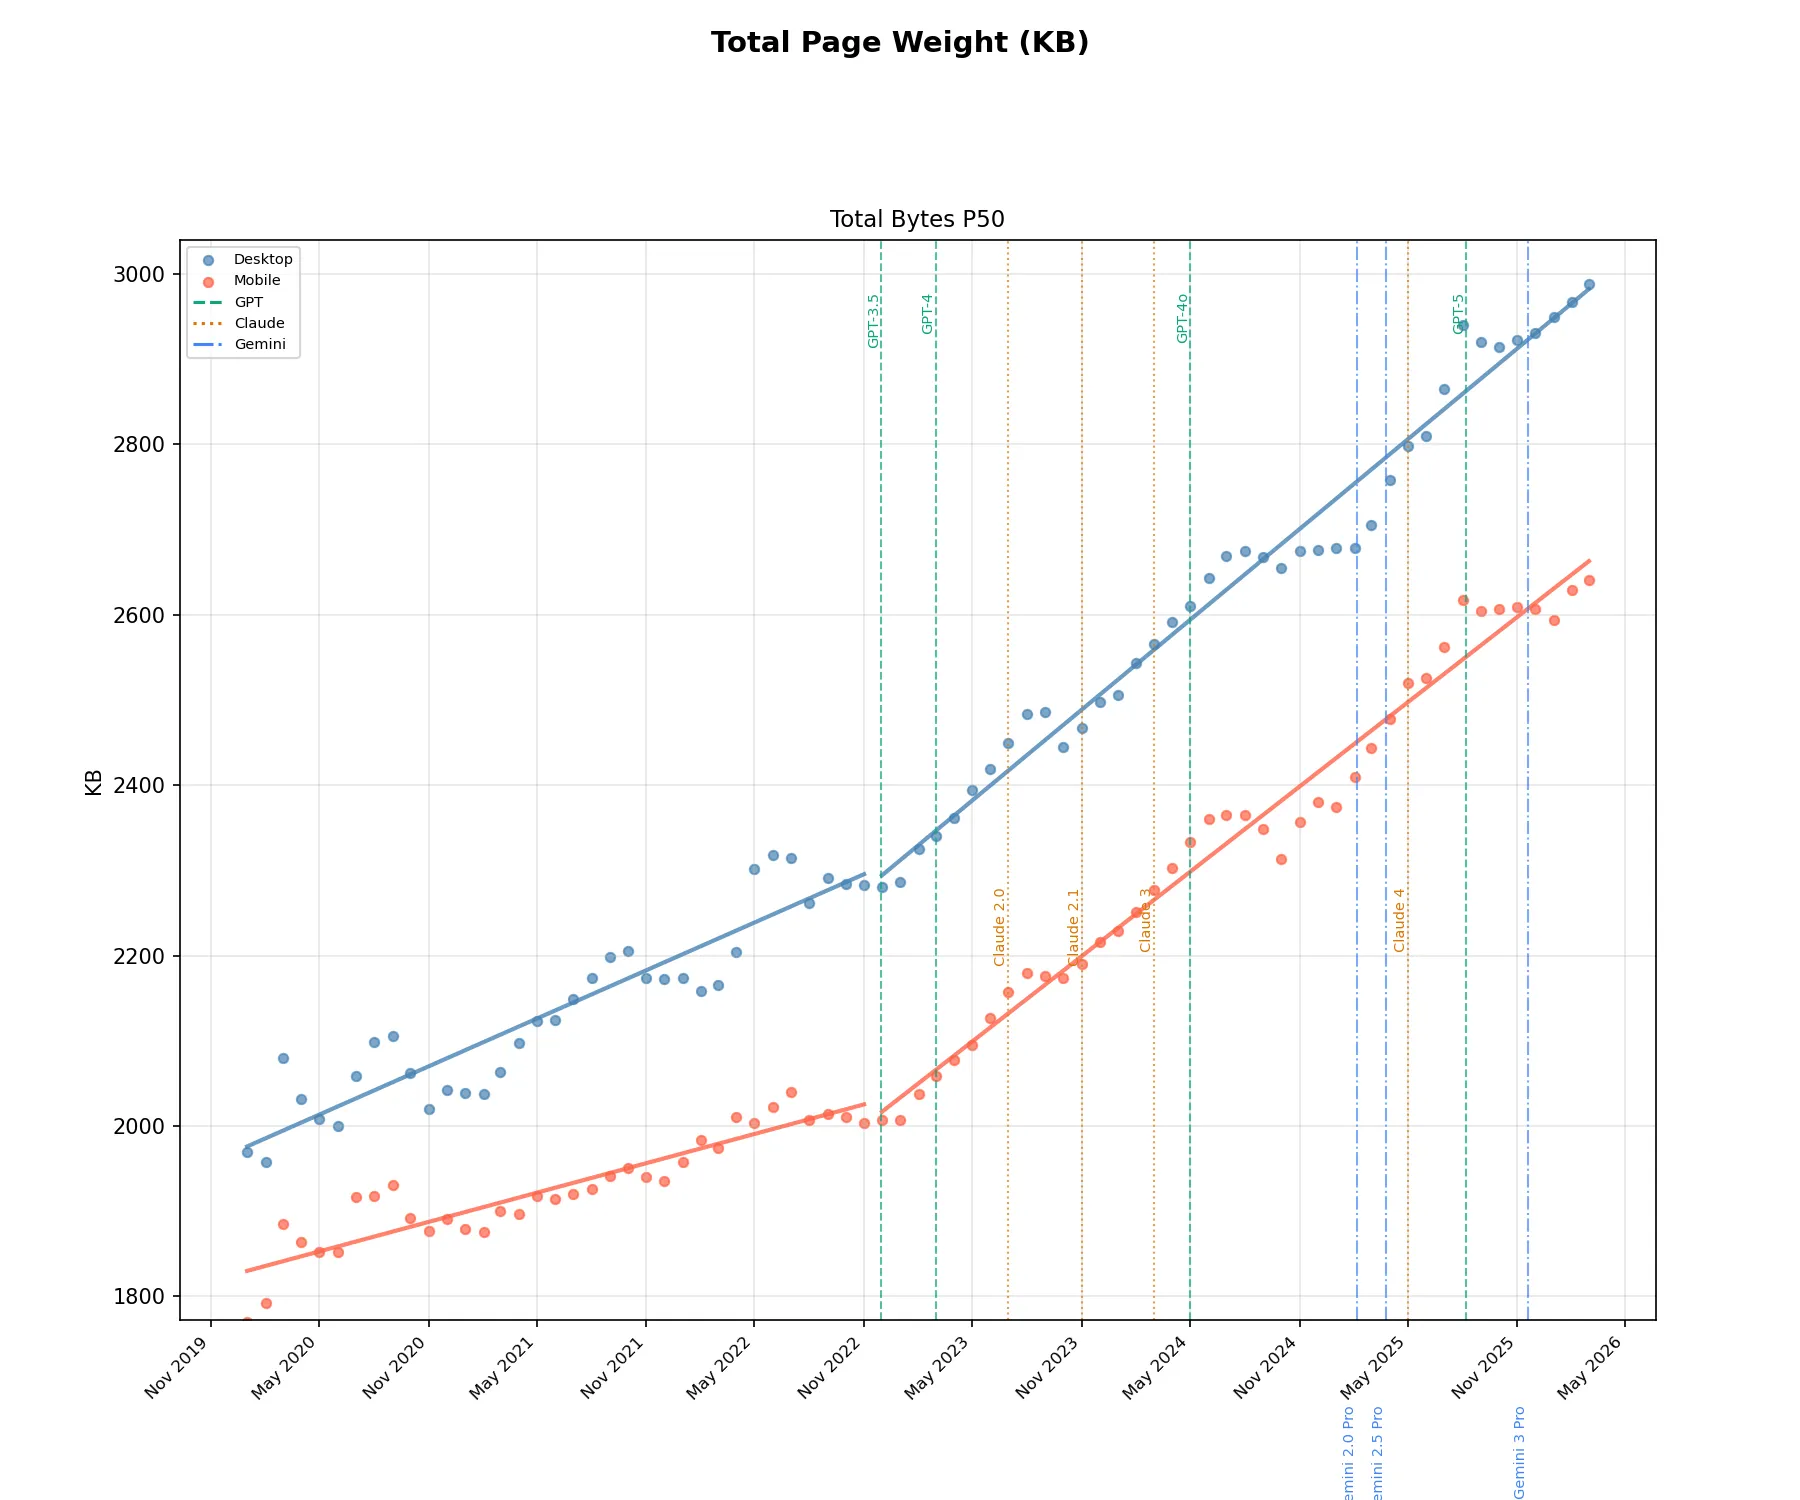
Page Weight Analysis
The page weight analysis examines p50, p75, and p90 data from the HTTPArchive. While page weights were already increasing steadily before AI, I applied a piecewise linear function to each dataset to highlight changes in the AI era.
View the data
| date | client | p50 | p75 | p90 |
|---|---|---|---|---|
| Mar-26 | desktop | 2988.1 | 5987.1 | 12617.7 |
| Mar-26 | mobile | 2641.4 | 5318.6 | 11491.4 |
| Feb-26 | desktop | 2967.6 | 5943.4 | 12468.3 |
| Feb-26 | mobile | 2629 | 5276 | 11337.4 |
| Jan-26 | desktop | 2950 | 5939.7 | 12483.2 |
| Jan-26 | mobile | 2593.4 | 5228.3 | 11308.2 |
| Dec-25 | desktop | 2930.6 | 5877.4 | 12344 |
| Dec-25 | mobile | 2606.7 | 5221.7 | 11222.1 |
| Nov-25 | desktop | 2923.1 | 5854.8 | 12275.9 |
| Nov-25 | mobile | 2608.8 | 5244.3 | 11184.3 |
| Oct-25 | desktop | 2914.5 | 5831.1 | 12204.3 |
| Oct-25 | mobile | 2606.7 | 5230.7 | 11112.7 |
| Sep-25 | desktop | 2920 | 5842.6 | 12221.3 |
| Sep-25 | mobile | 2604.1 | 5233.2 | 11079.6 |
| Aug-25 | desktop | 2940.4 | 5867.5 | 12195.5 |
| Aug-25 | mobile | 2617.6 | 5234.8 | 11036.7 |
| Jul-25 | desktop | 2865.6 | 5721.1 | 11979.3 |
| Jul-25 | mobile | 2562.5 | 5132.9 | 10854.8 |
| Jun-25 | desktop | 2809.9 | 5617.7 | 11757.6 |
| Jun-25 | mobile | 2526.2 | 5060.6 | 10703.8 |
| May-25 | desktop | 2797.9 | 5585.7 | 11675.2 |
| May-25 | mobile | 2519.9 | 5036.1 | 10602.1 |
| Apr-25 | desktop | 2758 | 5491 | 11404 |
| Apr-25 | mobile | 2477.3 | 4934.3 | 10338.9 |
| Mar-25 | desktop | 2705.9 | 5408.2 | 11179.1 |
| Mar-25 | mobile | 2443.2 | 4870.5 | 10176.5 |
| Feb-25 | desktop | 2678 | 5356.1 | 11104.6 |
| Feb-25 | mobile | 2409.8 | 4817.7 | 10082.8 |
| Jan-25 | desktop | 2677.9 | 5375.1 | 11171.9 |
| Jan-25 | mobile | 2374.1 | 4747.6 | 9936.7 |
| Dec-24 | desktop | 2675.7 | 5363.5 | 11122.2 |
| Dec-24 | mobile | 2379.8 | 4802.3 | 10101.5 |
| Nov-24 | desktop | 2675.2 | 5385 | 11161 |
| Nov-24 | mobile | 2356.6 | 4727.5 | 9827 |
| Oct-24 | desktop | 2655.1 | 5331 | 11025.8 |
| Oct-24 | mobile | 2313.7 | 4659.3 | 9704.2 |
| Sep-24 | desktop | 2668.3 | 5314 | 10623.2 |
| Sep-24 | mobile | 2348.6 | 4695.5 | 9648.5 |
| Aug-24 | desktop | 2675.4 | 5310.9 | 10573.5 |
| Aug-24 | mobile | 2365.2 | 4709.5 | 9614.1 |
| Jul-24 | desktop | 2669.5 | 5299.4 | 10525.6 |
| Jul-24 | mobile | 2364.7 | 4712.3 | 9647.9 |
| Jun-24 | desktop | 2643.5 | 5257.4 | 10407.5 |
| Jun-24 | mobile | 2360.5 | 4707 | 9607.5 |
| May-24 | desktop | 2610.9 | 5196.7 | 10289.7 |
| May-24 | mobile | 2333.3 | 4648.5 | 9513.7 |
| Apr-24 | desktop | 2591.3 | 5162.1 | 10199 |
| Apr-24 | mobile | 2302.3 | 4601.1 | 9386.9 |
| Mar-24 | desktop | 2565.9 | 5114.1 | 10095.8 |
| Mar-24 | mobile | 2277.3 | 4543.4 | 9309.3 |
| Feb-24 | desktop | 2543.6 | 5076.1 | 10022.3 |
| Feb-24 | mobile | 2251.7 | 4491.5 | 9201.3 |
| Jan-24 | desktop | 2505.3 | 5009 | 9941.2 |
| Jan-24 | mobile | 2228.9 | 4424.7 | 9088.4 |
| Dec-23 | desktop | 2497.5 | 4994 | 9899.1 |
| Dec-23 | mobile | 2216.1 | 4410.4 | 9049.1 |
| Nov-23 | desktop | 2467.5 | 4948.7 | 9799.3 |
| Nov-23 | mobile | 2190.2 | 4379.1 | 8985.2 |
| Oct-23 | desktop | 2445.3 | 4952 | 9789 |
| Oct-23 | mobile | 2174 | 4386.1 | 8981.5 |
| Sep-23 | desktop | 2485.7 | 4984.3 | 9810.2 |
| Sep-23 | mobile | 2175.9 | 4377.4 | 8962.9 |
| Aug-23 | desktop | 2484 | 4967.4 | 9743.8 |
| Aug-23 | mobile | 2179.1 | 4376.8 | 8946.1 |
| Jul-23 | desktop | 2449.4 | 4882.7 | 9609.3 |
| Jul-23 | mobile | 2157.7 | 4331.3 | 8858 |
| Jun-23 | desktop | 2419.6 | 4831.7 | 9505 |
| Jun-23 | mobile | 2126.7 | 4282.9 | 8747.8 |
| May-23 | desktop | 2393.8 | 4791.6 | 9376.2 |
| May-23 | mobile | 2095.4 | 4213.4 | 8593.7 |
| Apr-23 | desktop | 2361.1 | 4721.2 | 9238.5 |
| Apr-23 | mobile | 2076.9 | 4167.8 | 8488.5 |
| Mar-23 | desktop | 2340.6 | 4674.6 | 9165.4 |
| Mar-23 | mobile | 2058.3 | 4133.4 | 8420.4 |
| Feb-23 | desktop | 2324.8 | 4651.1 | 9135.4 |
| Feb-23 | mobile | 2037.3 | 4101.5 | 8340.4 |
| Jan-23 | desktop | 2286.3 | 4609.4 | 9051.6 |
| Jan-23 | mobile | 2006.6 | 4076.8 | 8296.9 |
| Dec-22 | desktop | 2280.8 | 4606.3 | 9038.5 |
| Dec-22 | mobile | 2006.7 | 4078 | 8271.9 |
| Nov-22 | desktop | 2282.8 | 4597.5 | 8984.9 |
| Nov-22 | mobile | 2003.3 | 4058.2 | 8210.5 |
| Oct-22 | desktop | 2284 | 4594 | 9004.3 |
| Oct-22 | mobile | 2010 | 4058.4 | 8195.4 |
| Sep-22 | desktop | 2291.6 | 4609 | 9000.3 |
| Sep-22 | mobile | 2014 | 4062.5 | 8191 |
| Aug-22 | desktop | 2262 | 4560.9 | 8932.6 |
| Aug-22 | mobile | 2007.3 | 4053.2 | 8164.6 |
| Jul-22 | desktop | 2314.4 | 4628.3 | 9033.4 |
| Jul-22 | mobile | 2040.4 | 4077.9 | 8164.2 |
| Jun-22 | desktop | 2317.8 | 4648.1 | 9071.4 |
| Jun-22 | mobile | 2022.5 | 4047 | 8089.7 |
| May-22 | desktop | 2301.6 | 4611.7 | 9006.6 |
| May-22 | mobile | 2003.2 | 4008.4 | 8019.7 |
| Apr-22 | desktop | 2203.8 | 4391.6 | 8502.7 |
| Apr-22 | mobile | 2010.6 | 3988.6 | 7687.6 |
| Mar-22 | desktop | 2165.5 | 4311.7 | 8319.4 |
| Mar-22 | mobile | 1974.1 | 3917.8 | 7564.6 |
| Feb-22 | desktop | 2159 | 4287.6 | 8271 |
| Feb-22 | mobile | 1984.1 | 3961.2 | 7574 |
| Jan-22 | desktop | 2174.1 | 4298.7 | 8204.6 |
| Jan-22 | mobile | 1957.6 | 3831.4 | 7038.8 |
| Dec-21 | desktop | 2173 | 4303.3 | 8215.2 |
| Dec-21 | mobile | 1935.2 | 3775.6 | 6965.1 |
| Nov-21 | desktop | 2173.3 | 4292.8 | 8162.5 |
| Nov-21 | mobile | 1940.4 | 3787.1 | 6967.4 |
| Oct-21 | desktop | 2204.8 | 4327.8 | 8196.6 |
| Oct-21 | mobile | 1950.9 | 3794.4 | 6956.1 |
| Sep-21 | desktop | 2198.4 | 4323.4 | 8189.2 |
| Sep-21 | mobile | 1941.5 | 3778.7 | 6945.6 |
| Aug-21 | desktop | 2174.2 | 4276.7 | 8106.6 |
| Aug-21 | mobile | 1925.9 | 3752.3 | 6895.6 |
| Jul-21 | desktop | 2148.7 | 4223.7 | 8001.2 |
| Jul-21 | mobile | 1920.1 | 3733.9 | 6854 |
| Jun-21 | desktop | 2124.1 | 4139.8 | 7729 |
| Jun-21 | mobile | 1914 | 3733 | 6840.7 |
| May-21 | desktop | 2123.6 | 4142.2 | 7701.7 |
| May-21 | mobile | 1917.4 | 3750.3 | 6850.4 |
| Apr-21 | desktop | 2096.8 | 4096.7 | 7609.5 |
| Apr-21 | mobile | 1896.2 | 3703.2 | 6779.4 |
| Mar-21 | desktop | 2063 | 4009.7 | 7444.8 |
| Mar-21 | mobile | 1900.1 | 3696.9 | 6763.5 |
| Feb-21 | desktop | 2037.7 | 3980.9 | 7418.9 |
| Feb-21 | mobile | 1875.8 | 3669.7 | 6706.9 |
| Jan-21 | desktop | 2038.4 | 3993.4 | 7452 |
| Jan-21 | mobile | 1879.3 | 3747.3 | 7044.6 |
| Dec-20 | desktop | 2042.3 | 3996.8 | 7419.6 |
| Dec-20 | mobile | 1891.2 | 3706.2 | 6735 |
| Nov-20 | desktop | 2020.3 | 3941.8 | 7330.6 |
| Nov-20 | mobile | 1876.3 | 3651.8 | 6663 |
| Oct-20 | desktop | 2062.4 | 3997.3 | 7396.6 |
| Oct-20 | mobile | 1891.6 | 3671.7 | 6703.3 |
| Sep-20 | desktop | 2105.3 | 4047.3 | 7464.7 |
| Sep-20 | mobile | 1930.7 | 3720.2 | 6770.6 |
| Aug-20 | desktop | 2098.8 | 4037.5 | 7442.3 |
| Aug-20 | mobile | 1917.5 | 3713 | 6775.3 |
| Jul-20 | desktop | 2059 | 3964.6 | 7309.2 |
| Jul-20 | mobile | 1916.8 | 3715.7 | 6779.2 |
| Jun-20 | desktop | 2000 | 3865 | 7131.7 |
| Jun-20 | mobile | 1852 | 3611 | 6607.4 |
| May-20 | desktop | 2007.9 | 3888.6 | 7155.1 |
| May-20 | mobile | 1851.9 | 3590.1 | 6489.7 |
| Apr-20 | desktop | 2031.9 | 3913.4 | 7192 |
| Apr-20 | mobile | 1864.2 | 3605.4 | 6510.5 |
| Mar-20 | desktop | 2080.2 | 3987.2 | 7310.6 |
| Mar-20 | mobile | 1885.3 | 3624.7 | 6548.6 |
| Feb-20 | desktop | 1957.9 | 3818.6 | 7067 |
| Feb-20 | mobile | 1791.8 | 3493.2 | 6362.1 |
| Jan-20 | desktop | 1969.6 | 3842 | 7128.4 |
| Jan-20 | mobile | 1770.4 | 3462.9 | 6322.1 |
p50
For p50, the slope of the lines shows a sharper increase in page weight in the post-AI date range for both desktop and mobile. This indicates a clear acceleration in page weight growth in the AI era. Notably, the p50 data shows the most significant before-and-after change in slope compared to p75 and p90.
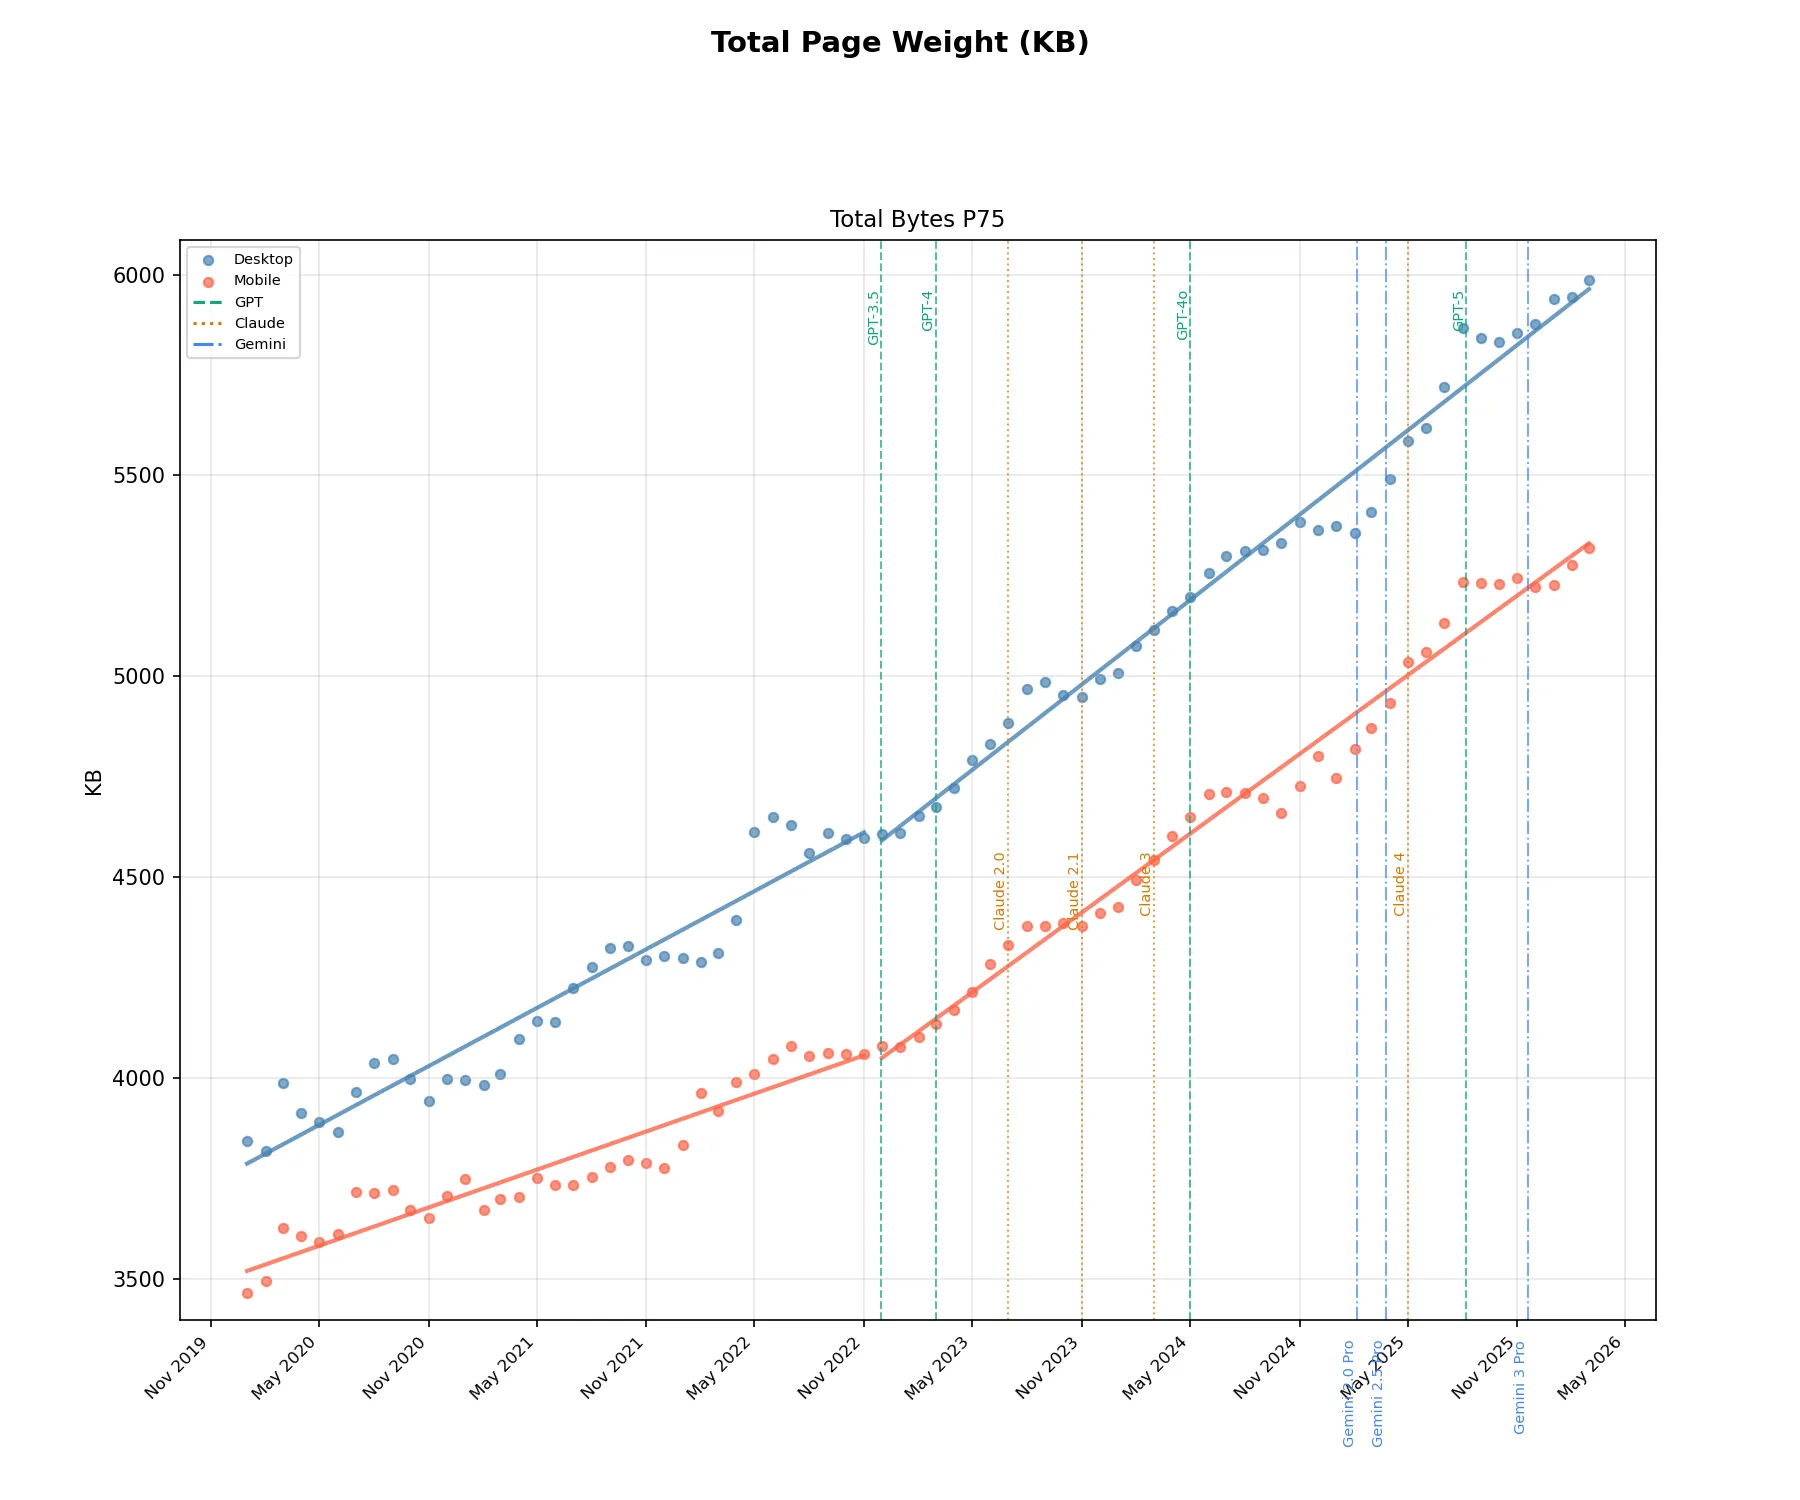
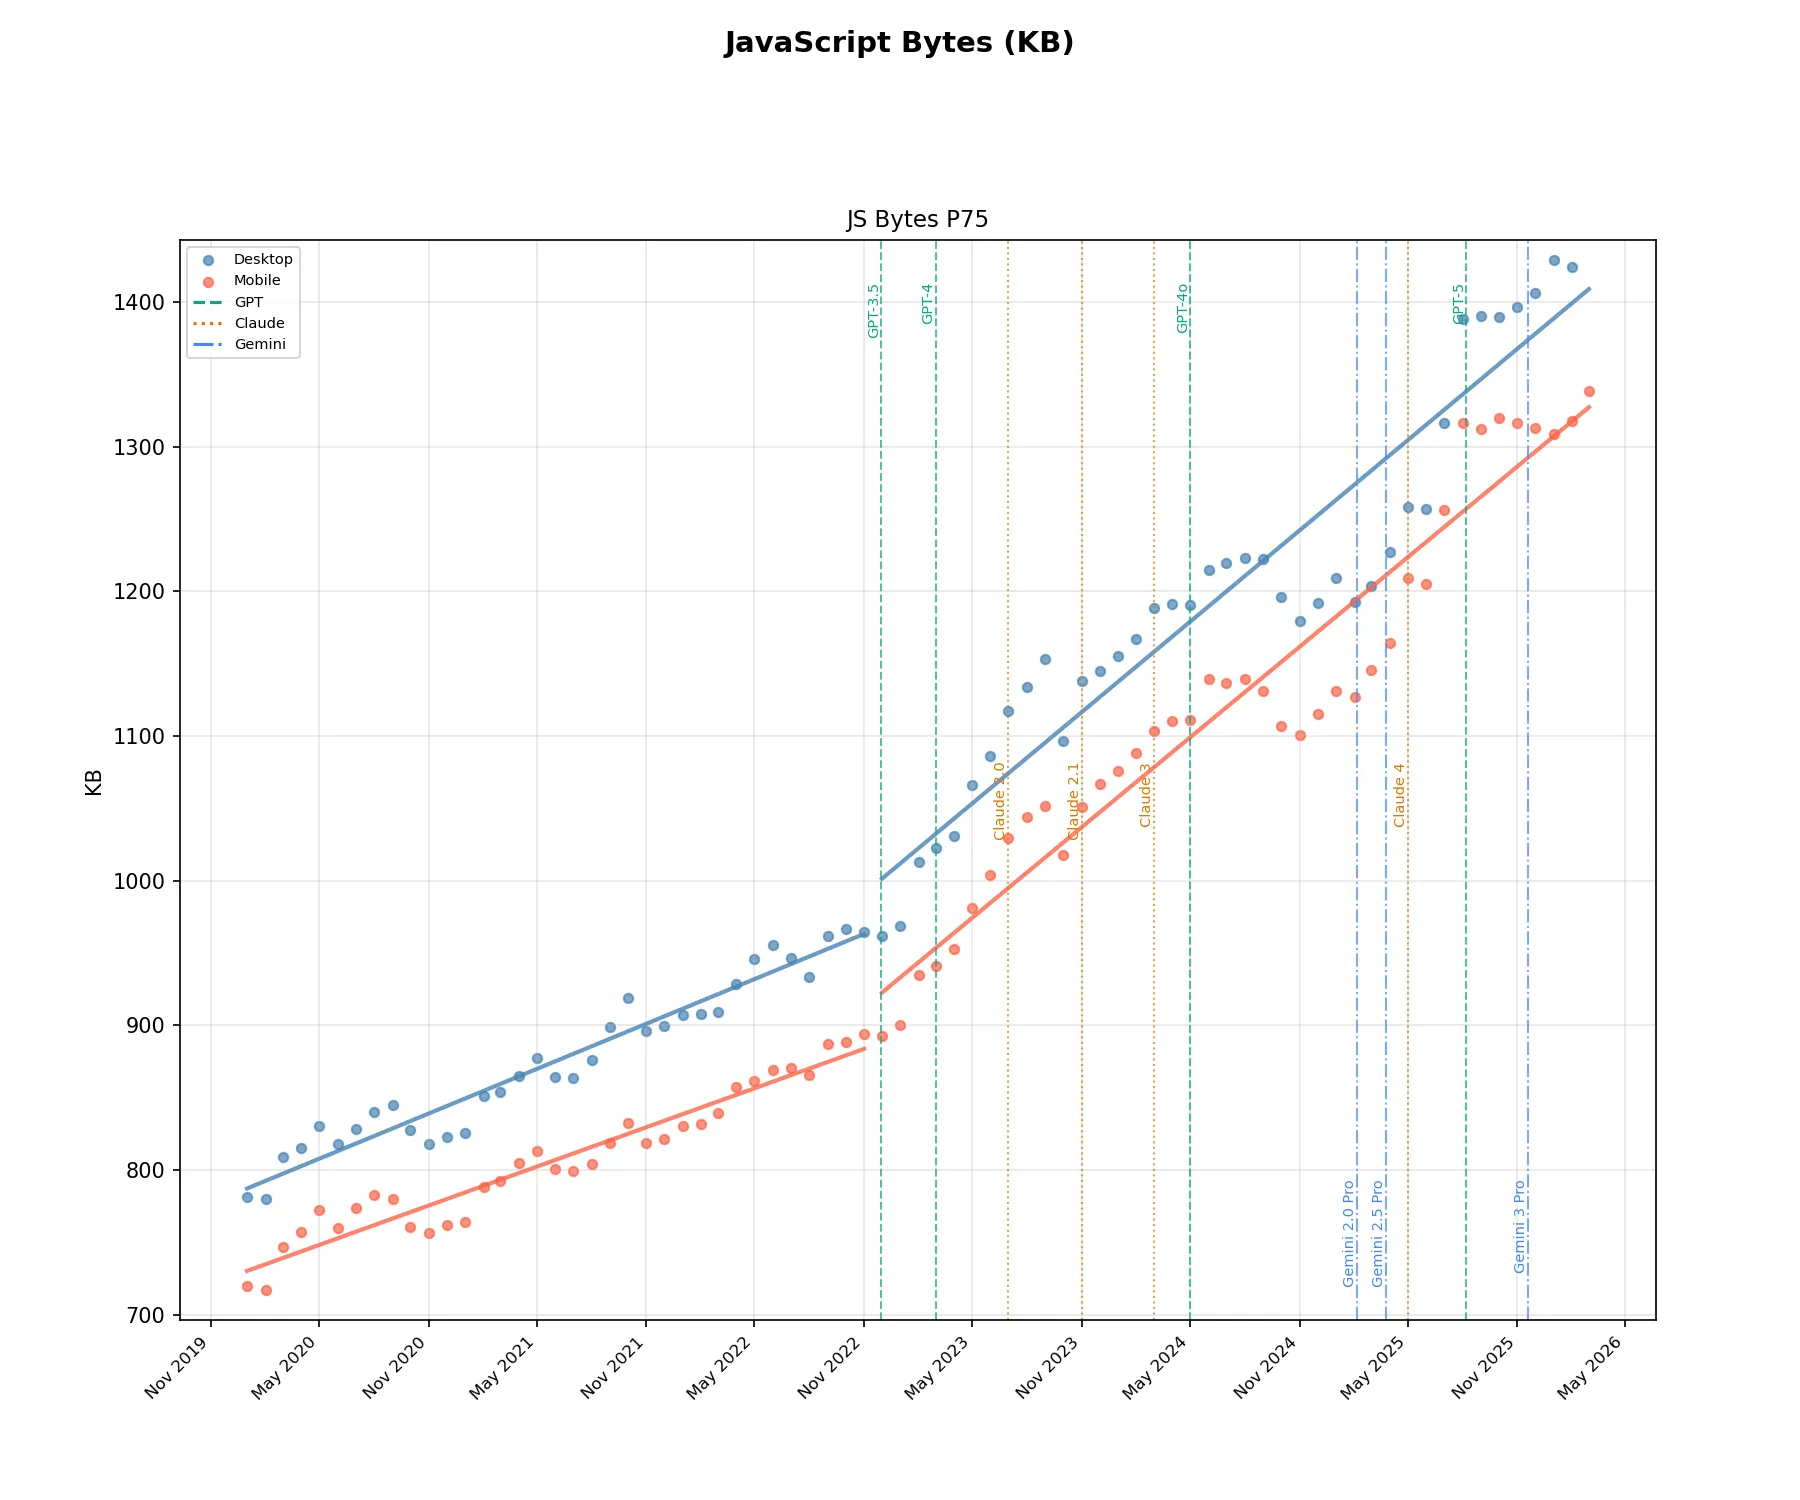
p75
At p75, the slope also increases in the AI era for desktop and mobile, though the difference is less pronounced than it is in the p50 data.
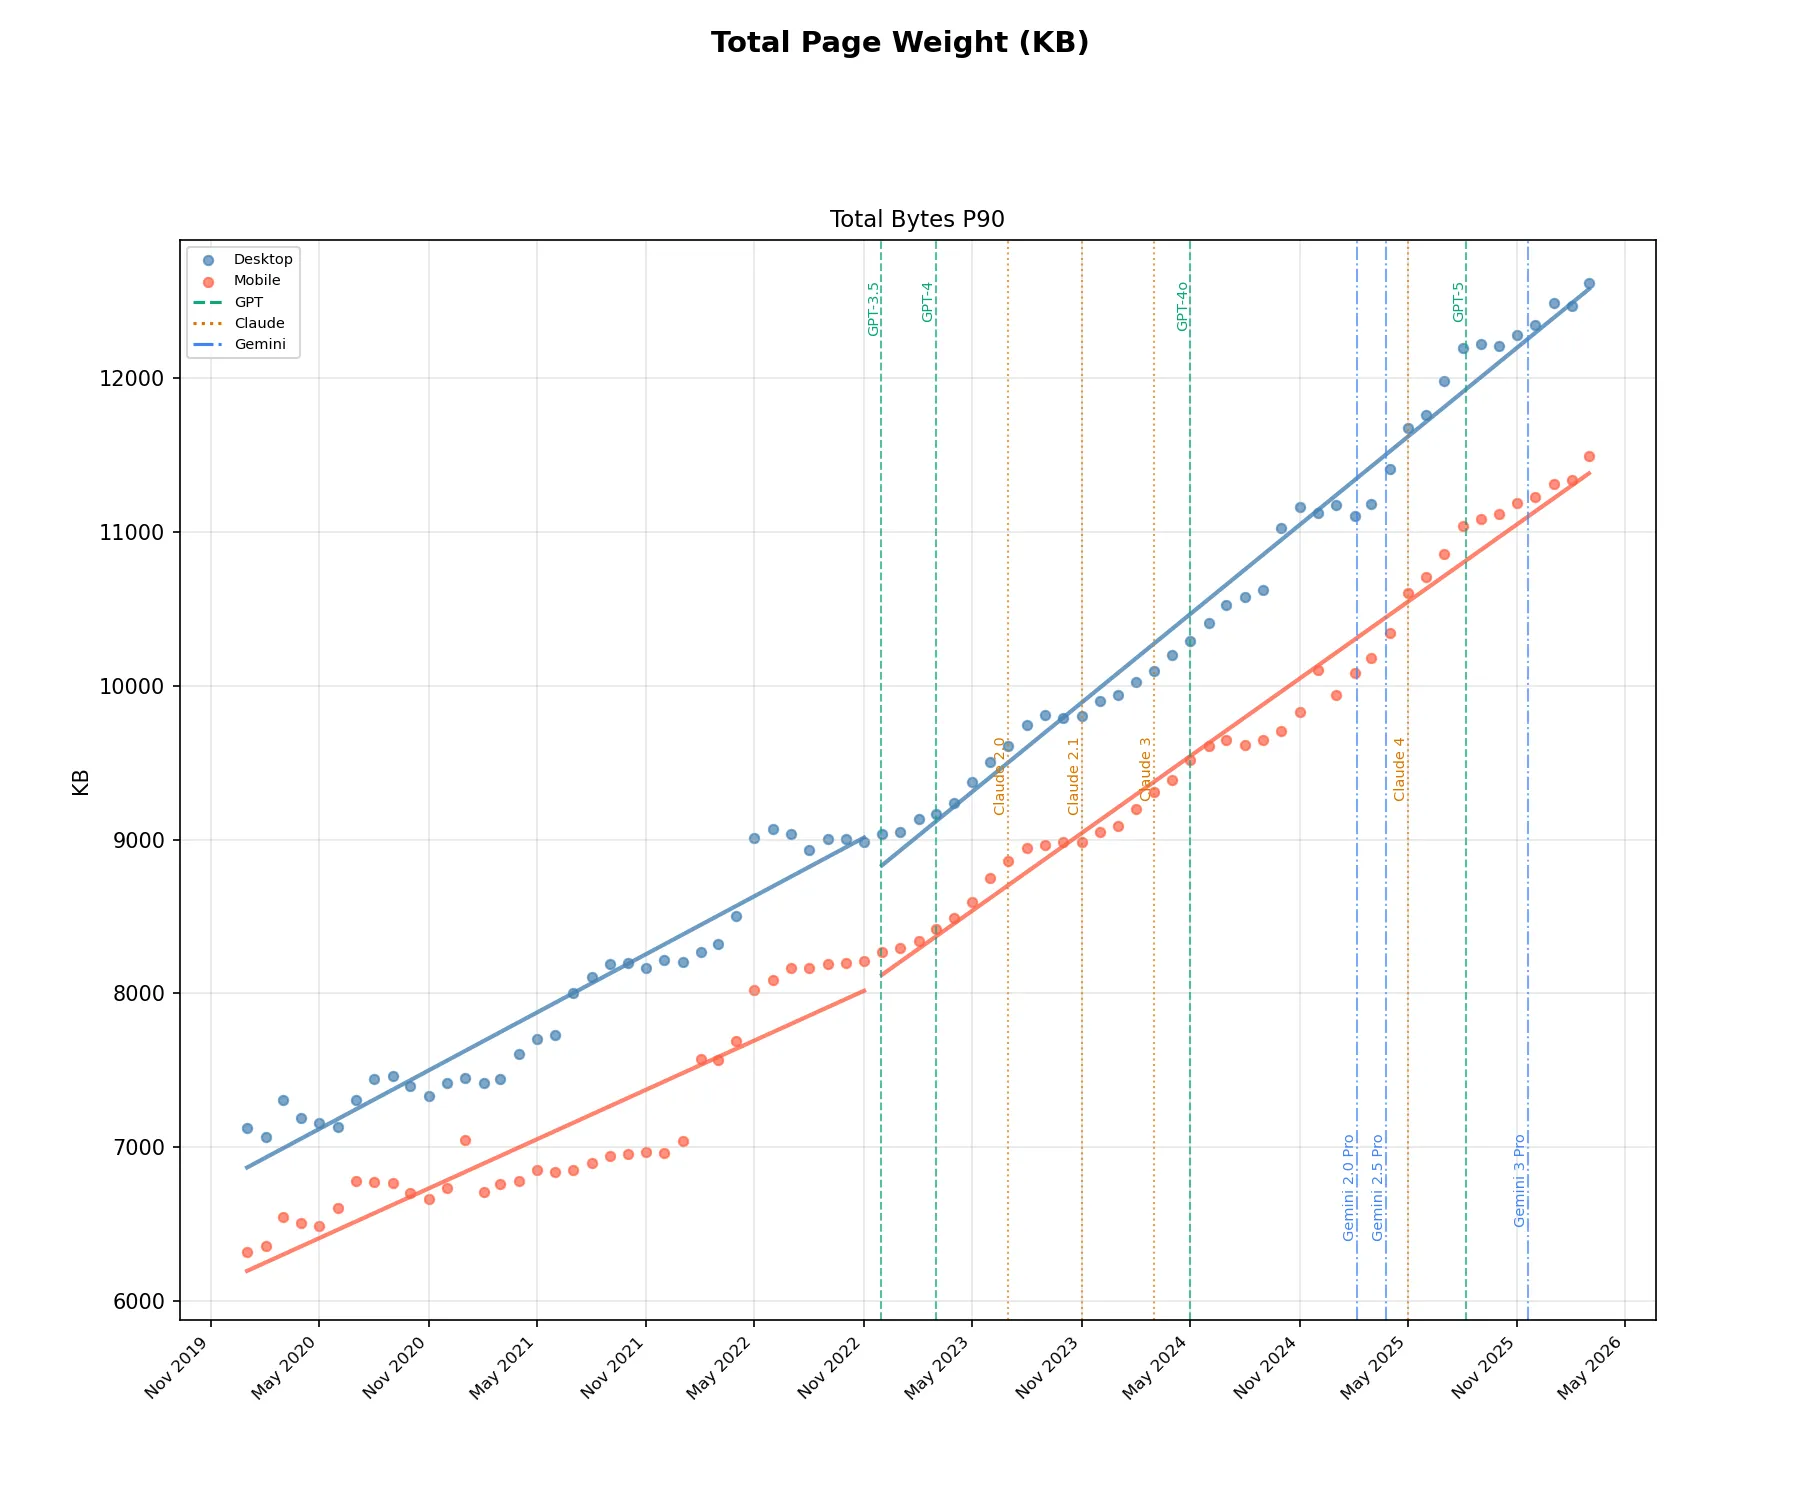
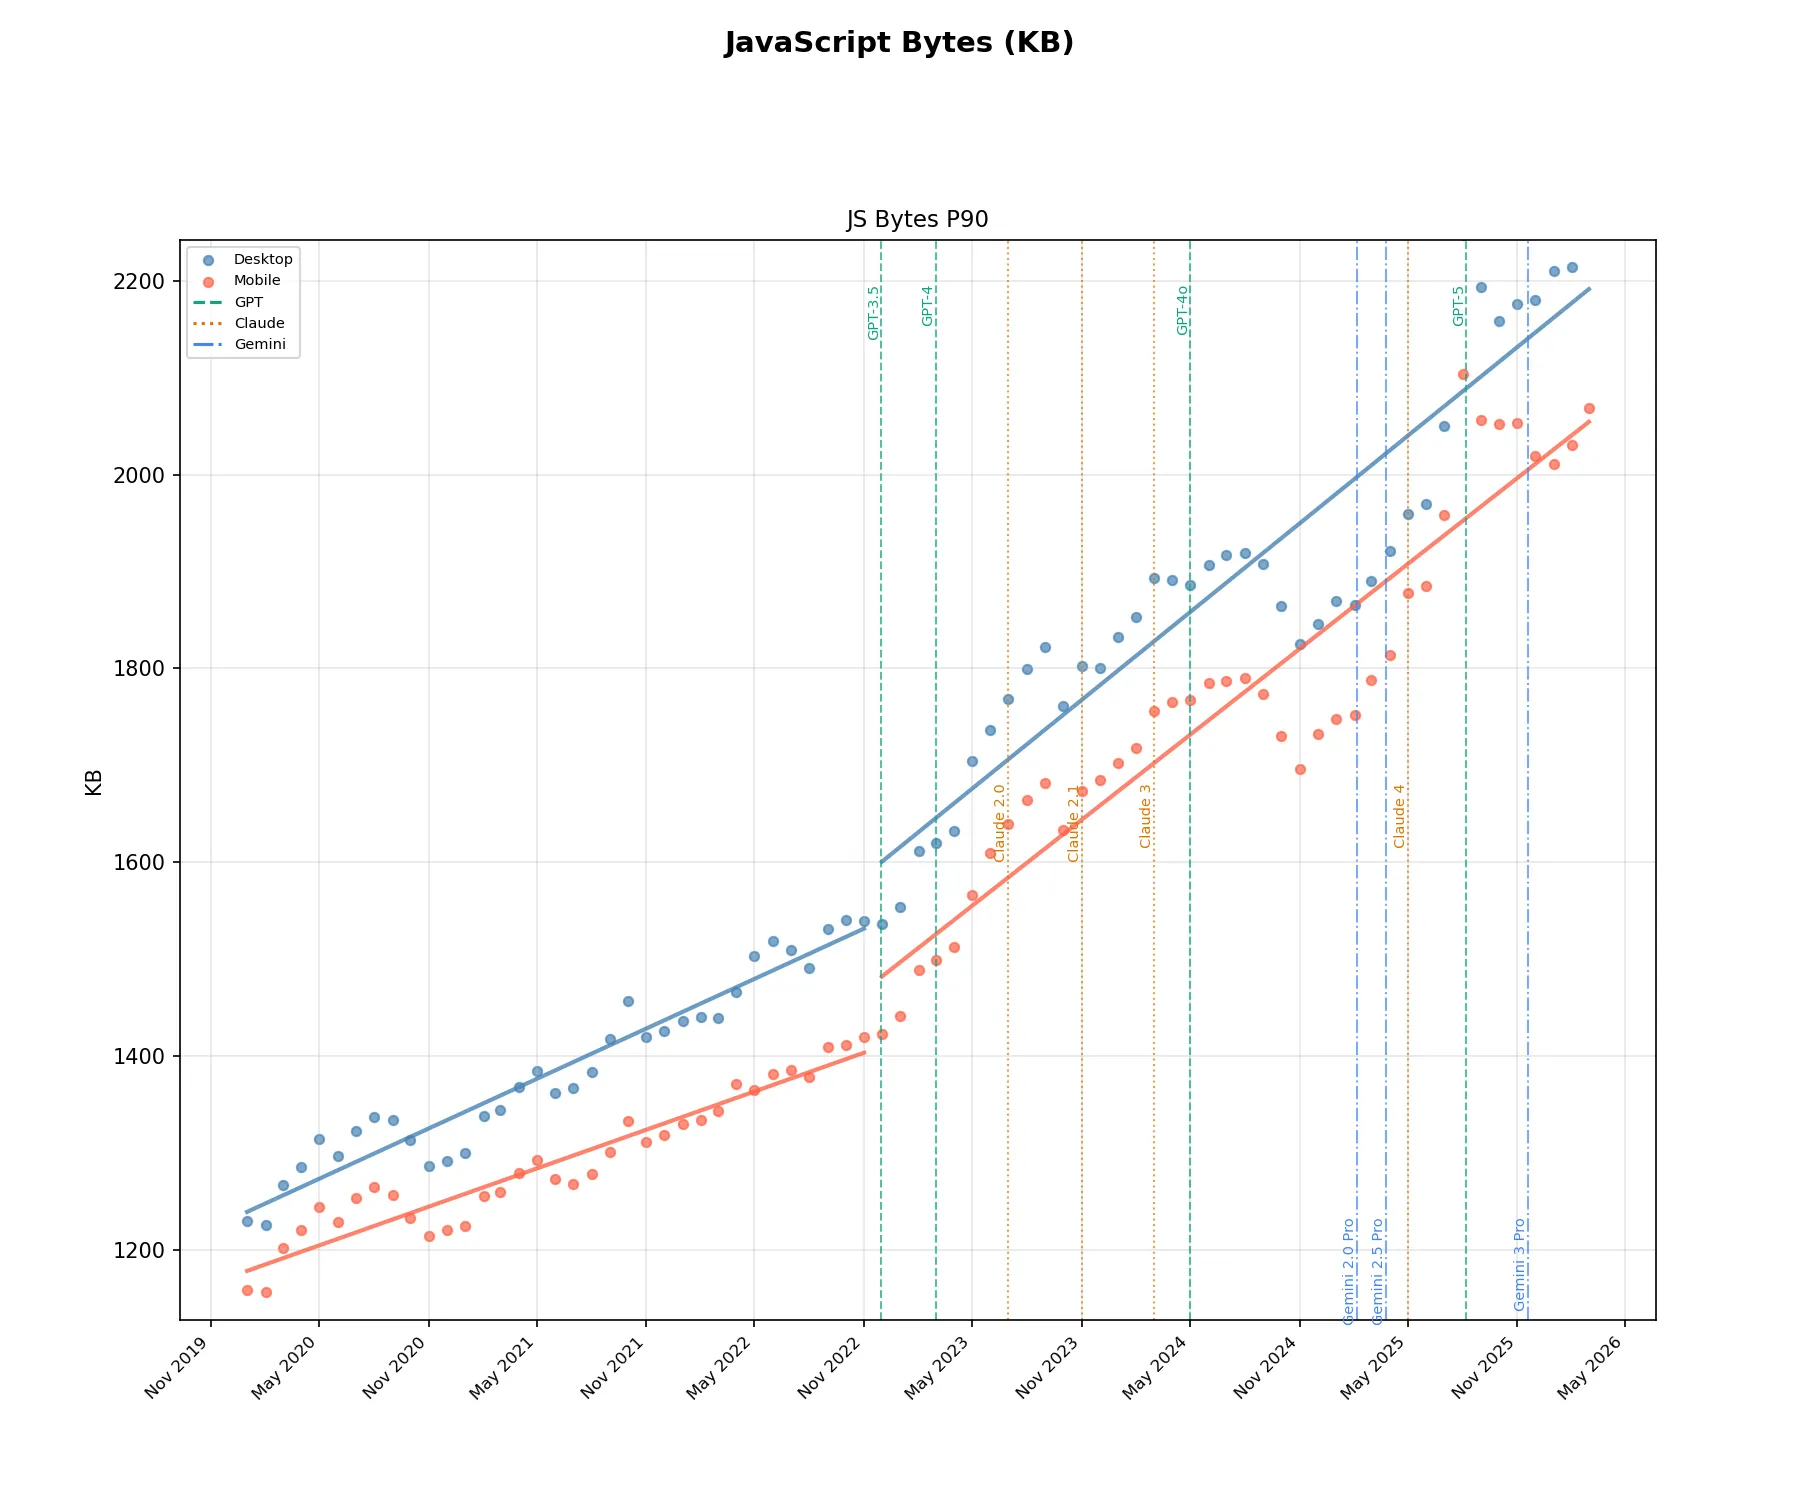
p90
The trend is harder to distinguish at p90, but slopes still increase in the AI era for both desktop and mobile. Similar to p75, the change in slope is less dramatic than that seen in the p50 data.
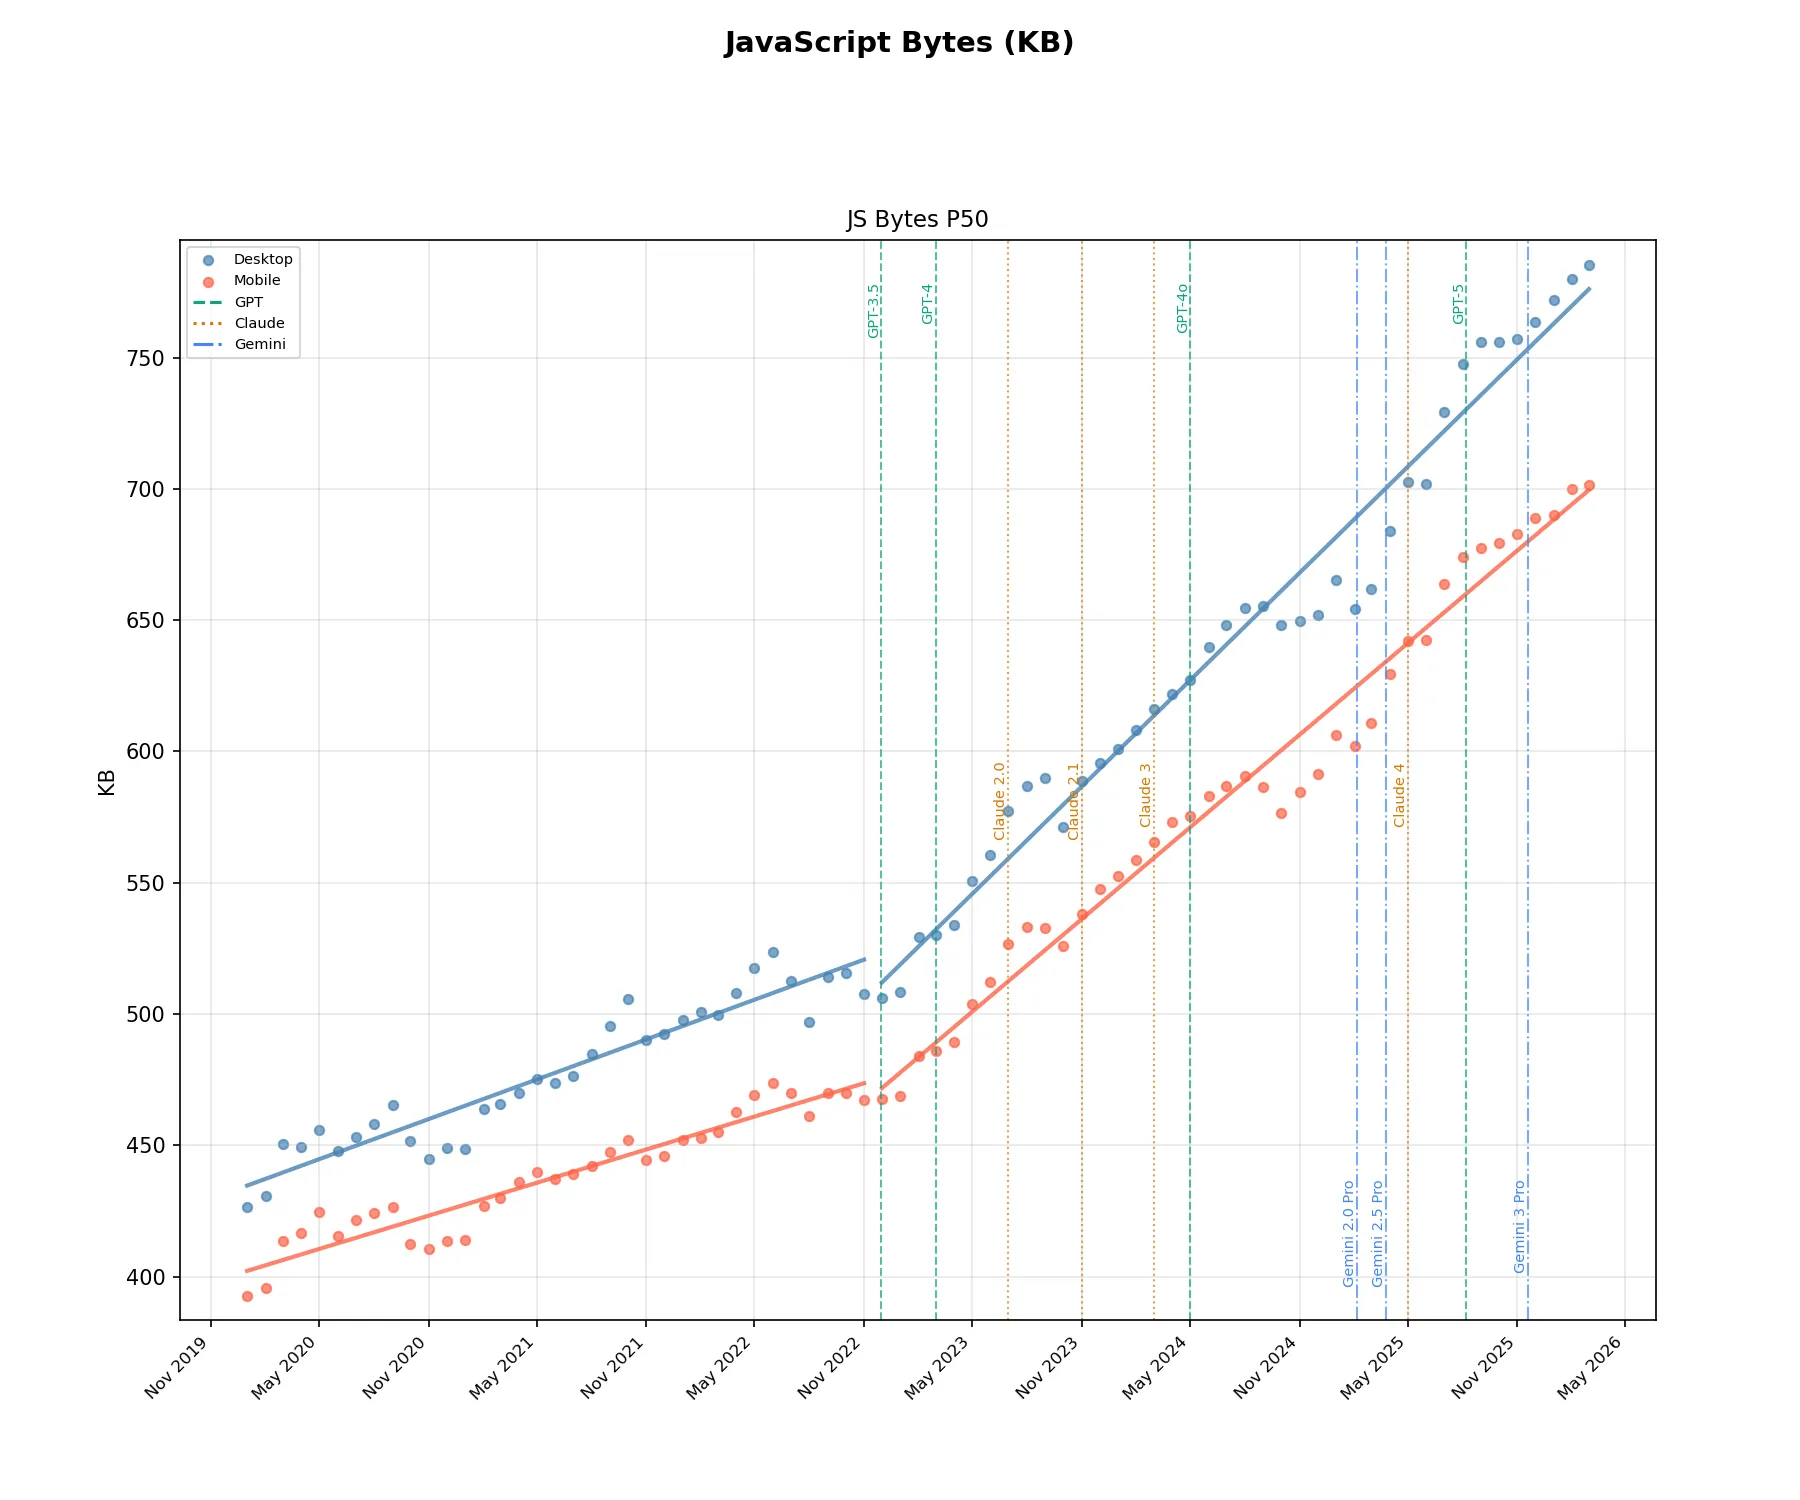
JavaScript Weight Analysis
The JavaScript weight analysis follows the same approach as page weight. Like overall page weight, JS weight has been trending upward for years. Since JS is computationally expensive, I was curious to see if the increase in JS was proportionate to the increase in total page weight.
View the data
| date | client | p50 | p75 | p90 |
|---|---|---|---|---|
| Mar-26 | desktop | 785.1 | 1450.4 | 2252.8 |
| Mar-26 | mobile | 701.6 | 1338.5 | 2069.2 |
| Feb-26 | desktop | 780.1 | 1424.3 | 2214.4 |
| Feb-26 | mobile | 700.1 | 1317.5 | 2030.7 |
| Jan-26 | desktop | 771.8 | 1429.4 | 2209.8 |
| Jan-26 | mobile | 689.9 | 1309 | 2010.9 |
| Dec-25 | desktop | 763.6 | 1406.1 | 2180.1 |
| Dec-25 | mobile | 689 | 1312.8 | 2018.9 |
| Nov-25 | desktop | 757.1 | 1396.3 | 2176.1 |
| Nov-25 | mobile | 683 | 1316.1 | 2053.7 |
| Oct-25 | desktop | 755.8 | 1389.4 | 2158.9 |
| Oct-25 | mobile | 679.5 | 1320 | 2052.3 |
| Sep-25 | desktop | 756.1 | 1390.1 | 2193.3 |
| Sep-25 | mobile | 677.6 | 1312.5 | 2056.7 |
| Aug-25 | desktop | 747.5 | 1388.1 | 2247.4 |
| Aug-25 | mobile | 673.9 | 1316.2 | 2104 |
| Jul-25 | desktop | 729.1 | 1316.7 | 2050.2 |
| Jul-25 | mobile | 663.9 | 1256.1 | 1958.6 |
| Jun-25 | desktop | 702 | 1257.1 | 1969.2 |
| Jun-25 | mobile | 642.4 | 1205.1 | 1885.3 |
| May-25 | desktop | 702.8 | 1258.5 | 1959.8 |
| May-25 | mobile | 642 | 1209.2 | 1878.1 |
| Apr-25 | desktop | 684.1 | 1227.4 | 1921.3 |
| Apr-25 | mobile | 629.5 | 1164.4 | 1813.6 |
| Mar-25 | desktop | 662 | 1203.4 | 1889.8 |
| Mar-25 | mobile | 611 | 1145.3 | 1788.5 |
| Feb-25 | desktop | 654.3 | 1192.9 | 1865.3 |
| Feb-25 | mobile | 602.1 | 1126.7 | 1751.6 |
| Jan-25 | desktop | 665.3 | 1209.3 | 1869.1 |
| Jan-25 | mobile | 606.4 | 1131.3 | 1747.5 |
| Dec-24 | desktop | 652.1 | 1192.2 | 1845.9 |
| Dec-24 | mobile | 591.3 | 1115.5 | 1732.3 |
| Nov-24 | desktop | 649.7 | 1179.3 | 1825.2 |
| Nov-24 | mobile | 584.6 | 1100.8 | 1696.6 |
| Oct-24 | desktop | 648.3 | 1196.1 | 1864.3 |
| Oct-24 | mobile | 576.4 | 1107.1 | 1729.9 |
| Sep-24 | desktop | 655.3 | 1222.5 | 1908.2 |
| Sep-24 | mobile | 586.3 | 1130.8 | 1773.1 |
| Aug-24 | desktop | 654.6 | 1223.4 | 1919.2 |
| Aug-24 | mobile | 590.5 | 1139.6 | 1790.4 |
| Jul-24 | desktop | 648 | 1219.3 | 1917.4 |
| Jul-24 | mobile | 586.9 | 1137 | 1787.4 |
| Jun-24 | desktop | 639.7 | 1214.8 | 1906.9 |
| Jun-24 | mobile | 583.2 | 1139.7 | 1784.7 |
| May-24 | desktop | 627.4 | 1190.3 | 1886 |
| May-24 | mobile | 575.6 | 1111.3 | 1767.2 |
| Apr-24 | desktop | 622 | 1191 | 1890.8 |
| Apr-24 | mobile | 573 | 1110.3 | 1765.7 |
| Mar-24 | desktop | 616.2 | 1188.7 | 1893.7 |
| Mar-24 | mobile | 565.5 | 1103.4 | 1755.7 |
| Feb-24 | desktop | 608 | 1167.4 | 1853 |
| Feb-24 | mobile | 558.8 | 1088 | 1717.6 |
| Jan-24 | desktop | 601.1 | 1155.1 | 1832.6 |
| Jan-24 | mobile | 552.6 | 1076.1 | 1702.5 |
| Dec-23 | desktop | 595.5 | 1145.2 | 1800.5 |
| Dec-23 | mobile | 547.6 | 1066.7 | 1684.5 |
| Nov-23 | desktop | 588.6 | 1138.2 | 1802.7 |
| Nov-23 | mobile | 538.1 | 1050.6 | 1673.2 |
| Oct-23 | desktop | 571.3 | 1096.8 | 1760.8 |
| Oct-23 | mobile | 525.8 | 1017.4 | 1633.5 |
| Sep-23 | desktop | 590 | 1153.4 | 1822.4 |
| Sep-23 | mobile | 532.8 | 1051.9 | 1681.2 |
| Aug-23 | desktop | 587 | 1134.1 | 1799.8 |
| Aug-23 | mobile | 533.3 | 1043.8 | 1663.8 |
| Jul-23 | desktop | 577.3 | 1117.6 | 1768.8 |
| Jul-23 | mobile | 526.6 | 1029.2 | 1639.4 |
| Jun-23 | desktop | 560.5 | 1086.5 | 1736.2 |
| Jun-23 | mobile | 512.1 | 1004.2 | 1609 |
| May-23 | desktop | 550.6 | 1066.1 | 1703.9 |
| May-23 | mobile | 503.8 | 980.8 | 1566.6 |
| Apr-23 | desktop | 533.8 | 1031.2 | 1632.6 |
| Apr-23 | mobile | 489.4 | 952.5 | 1512.4 |
| Mar-23 | desktop | 530 | 1022.6 | 1620 |
| Mar-23 | mobile | 485.8 | 941.1 | 1499.5 |
| Feb-23 | desktop | 529.2 | 1012.9 | 1611.2 |
| Feb-23 | mobile | 484.2 | 934.5 | 1488.8 |
| Jan-23 | desktop | 508.5 | 968.9 | 1553.7 |
| Jan-23 | mobile | 468.7 | 900.2 | 1441 |
| Dec-22 | desktop | 506 | 961.5 | 1535.9 |
| Dec-22 | mobile | 467.5 | 892.8 | 1422.8 |
| Nov-22 | desktop | 507.6 | 964.6 | 1538.8 |
| Nov-22 | mobile | 467.4 | 893.7 | 1419.3 |
| Oct-22 | desktop | 515.6 | 966.7 | 1540.1 |
| Oct-22 | mobile | 469.8 | 888.7 | 1411.6 |
| Sep-22 | desktop | 514 | 962 | 1531 |
| Sep-22 | mobile | 469.8 | 886.8 | 1409.5 |
| Aug-22 | desktop | 496.9 | 933.1 | 1490.3 |
| Aug-22 | mobile | 461.3 | 865.9 | 1378.8 |
| Jul-22 | desktop | 512.6 | 946.6 | 1509.3 |
| Jul-22 | mobile | 469.8 | 870.5 | 1385.3 |
| Jun-22 | desktop | 523.5 | 955.4 | 1518.9 |
| Jun-22 | mobile | 473.9 | 869.3 | 1381.1 |
| May-22 | desktop | 517.7 | 946 | 1502.8 |
| May-22 | mobile | 469.2 | 861.2 | 1365.3 |
| Apr-22 | desktop | 508.1 | 928.4 | 1465.7 |
| Apr-22 | mobile | 462.6 | 857.4 | 1371.5 |
| Mar-22 | desktop | 499.7 | 909.3 | 1438.9 |
| Mar-22 | mobile | 455.2 | 839.7 | 1342.7 |
| Feb-22 | desktop | 500.7 | 907.7 | 1439.9 |
| Feb-22 | mobile | 452.7 | 831.6 | 1334 |
| Jan-22 | desktop | 497.7 | 907 | 1435.8 |
| Jan-22 | mobile | 452.2 | 830.7 | 1330.3 |
| Dec-21 | desktop | 492.3 | 899.7 | 1425.5 |
| Dec-21 | mobile | 446 | 821.3 | 1318.2 |
| Nov-21 | desktop | 490.3 | 895.8 | 1419.5 |
| Nov-21 | mobile | 444.4 | 818.5 | 1311.4 |
| Oct-21 | desktop | 505.6 | 918.8 | 1456.3 |
| Oct-21 | mobile | 452 | 832.7 | 1332.7 |
| Sep-21 | desktop | 495.3 | 898.5 | 1418 |
| Sep-21 | mobile | 447.6 | 818.5 | 1301.1 |
| Aug-21 | desktop | 484.7 | 875.9 | 1383.6 |
| Aug-21 | mobile | 442 | 804.1 | 1277.7 |
| Jul-21 | desktop | 476.4 | 863.7 | 1367.4 |
| Jul-21 | mobile | 439 | 799.3 | 1268.1 |
| Jun-21 | desktop | 473.8 | 864 | 1361.4 |
| Jun-21 | mobile | 437.2 | 800.6 | 1272.8 |
| May-21 | desktop | 475.1 | 877.1 | 1385 |
| May-21 | mobile | 439.8 | 813.1 | 1292.5 |
| Apr-21 | desktop | 470.1 | 864.7 | 1368.3 |
| Apr-21 | mobile | 436.1 | 805 | 1279.3 |
| Mar-21 | desktop | 465.6 | 853.9 | 1343.8 |
| Mar-21 | mobile | 429.9 | 792.2 | 1259.5 |
| Feb-21 | desktop | 463.9 | 850.9 | 1338.5 |
| Feb-21 | mobile | 427 | 788 | 1255.1 |
| Jan-21 | desktop | 448.7 | 825.8 | 1299.5 |
| Jan-21 | mobile | 414 | 764.3 | 1224.3 |
| Dec-20 | desktop | 449 | 822.8 | 1291.8 |
| Dec-20 | mobile | 413.7 | 761.6 | 1220.5 |
| Nov-20 | desktop | 444.9 | 817.7 | 1286.6 |
| Nov-20 | mobile | 410.5 | 756.6 | 1214.5 |
| Oct-20 | desktop | 451.7 | 827.6 | 1313.5 |
| Oct-20 | mobile | 412.6 | 760.6 | 1233 |
| Sep-20 | desktop | 465.4 | 844.7 | 1334 |
| Sep-20 | mobile | 426.4 | 780.1 | 1256.3 |
| Aug-20 | desktop | 458 | 839.8 | 1337 |
| Aug-20 | mobile | 424.4 | 782.5 | 1265 |
| Jul-20 | desktop | 453 | 828.1 | 1322.9 |
| Jul-20 | mobile | 421.5 | 773.5 | 1253.7 |
| Jun-20 | desktop | 447.7 | 817.9 | 1296.3 |
| Jun-20 | mobile | 415.3 | 759.8 | 1228.6 |
| May-20 | desktop | 456 | 830.4 | 1314.8 |
| May-20 | mobile | 424.6 | 772.6 | 1243.7 |
| Apr-20 | desktop | 449.2 | 815.5 | 1285.1 |
| Apr-20 | mobile | 416.8 | 757.4 | 1220.4 |
| Mar-20 | desktop | 450.5 | 808.8 | 1267.2 |
| Mar-20 | mobile | 413.5 | 746.8 | 1201.5 |
| Feb-20 | desktop | 430.9 | 779.9 | 1225.7 |
| Feb-20 | mobile | 395.6 | 717.2 | 1156.5 |
| Jan-20 | desktop | 426.7 | 781 | 1229.7 |
| Jan-20 | mobile | 392.8 | 719.9 | 1159 |
p50
For p50, the post-AI slope for JS weight shows a sharper increase for both desktop and mobile. The post-AI acceleration for JS at p50 is steeper than any of the overall page weight trends, meaning the growth in JS weight is accelerating faster than page weight as a whole.
p75
For p75, the slope of the lines increases in the post-AI date range for both desktop and mobile. When compared to the page weight at p75, the change in slope in the before-and-after data for JS is more pronounced.
p90
At p90, slopes also increase post-AI for desktop and mobile. As with p75, this shift is more pronounced for JS than it is for overall page weight at p90.
Conclusion
The adoption of AI correlates with a significant increase in both page weight and JavaScript weight. These trends are consistent across p50, p75, and p90, with the most pronounced effects at the median (p50). This acceleration is particularly concerning for JavaScript, given its high computational cost.
* Thanks to Barry Pollard for his help with the data. He’s always answering questions from the performance community as a whole, and we’re lucky to have him. You’re a good one, Barry!