Metrics such as web vitals can help identify performance issues, but it’s easy to look at these in isolation and miss critical pieces of information. On the other hand, looking at the relationship between these metrics can let you see the bigger picture.
The relationship between metrics often produces gaps of time that occur between data points, and these gaps help inform the performance strategy. I refer to the time difference between performance metrics as “experience gaps.”
There are several types of gaps to look at, and reducing gaps between specific data points can be transformative to a site’s performance. Let’s take a look at some of these using WebPageTest on one of my favorite places to shop, REI.
Gaps between page landmarks
Web vitals have several important metrics that chart a page’s loading progress. Time to First Byte (TTFB), First Contentful Paint (FCP), and Largest Contentful Paint (LCP) are a trio of metrics that indicate page progress and are landmarks that happen in a specific order.
Let’s examine the product details page for a backpack. Using a test profile of the first view, median of 3 runs, desktop Chrome on a cable connection (5mbps) from Virginia, we can immediately point out some issues.
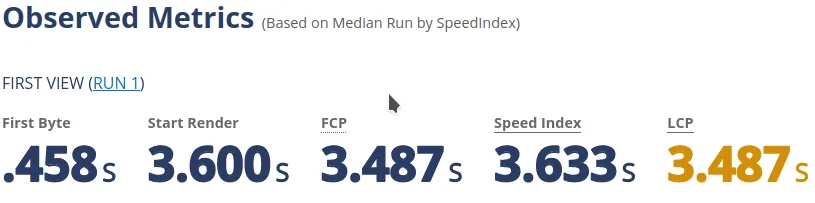
The time gap between TTFB and FCP tells me that something is blocking the render process. In REI’s case, there are a few issues.
Blocking assets in the <head>
Looking at the waterfall chart, there are a number of resources in the <head> that are blocking.
In this case, the blocking assets are any CSS loaded with a <link href="..."> and a matching media attribute, and any JS loaded with a <script src="..."> that does not contain a defer, async, or type="module" attribute.
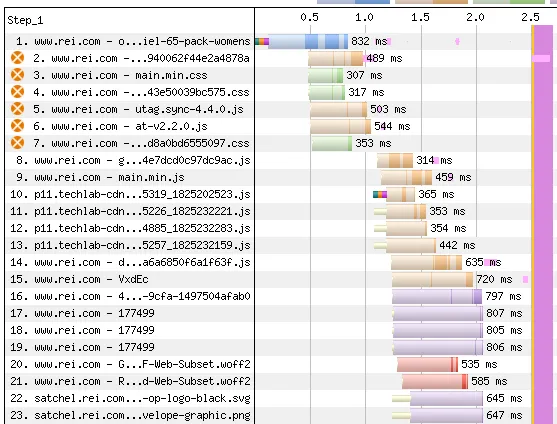
<head> of the site as indicated by the orange icon.Also looking at what is in the <head>, where the <script> and <link> tags are located and grouped could also be sorted to a more ideal order. If you notice, the order of the blocking assets bounces between CSS and JS files as follows:
- 1 blocking JS file
- 2 blocking CSS files
- 2 blocking JS files
- 1 blocking CSS file
These are also interspersed with other assets such as inline scripts and styles, which is problematic.
The ideal load order is described in this presentation by Harry Roberts.
If these assets were grouped together by type and loading strategy, it could make a big difference. If it was possible to load the script with defer or use the module/nomodule pattern, that would improve performance.
Given that the assets in the <head> are largely shared by a number of page templates on the site, sorting out the blocking issues could potentially improve every page in the user’s journey.
Time between FCP and LCP
The FCP happens at the same time as the LCP in this case. When the LCP element is an image on a site this size and happens at the exact same time as the FCP, that is another indicator of more render blocking.
In REI’s case, the LCP image is finished downloading around the 2 second mark, but it doesn’t show up on the screen until 1.4 seconds later.
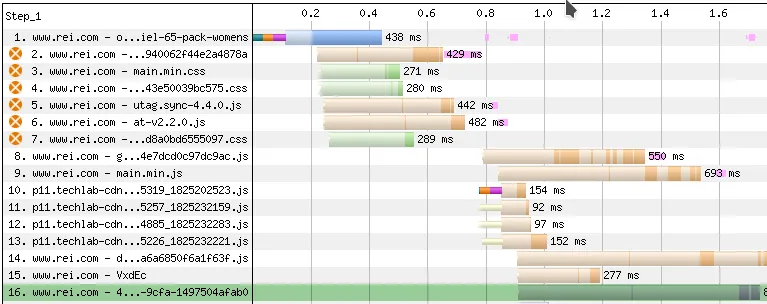
As it turns out, REI uses client-side A/B testing (Adobe Target), and it has an “anti-flicker” snippet that hides the page until the test is finished loading.
The trade-off with the anti-flicker snippet is that the user doesn’t see things getting replaced on the page as the tests are loaded, but it does significantly impact the performance of the site since the whole UI is hidden while waiting on the A/B tests.
| Page Variant | FCP | LCP (s) |
|---|---|---|
| With Adobe Target | 3.487 | 3.487 |
| Without Adobe Target | 0.893 | 1.905 |
I understand that there is value in testing variations of pages, but A/B on the client-side results in a 1.5 second penalty in the LCP and an even bigger one for the FCP, and that is on desktop. It’s even larger on a mid-tier mobile device.
In this case, if REI was able to use server-side A/B testing, that would be a huge difference-maker for their performance.
HTML size
The HTML is compressed with gzip, but the uncompressed size is over 1MB. HTML size isn’t always an issue for large gaps between TTFB and FCP, but it does contribute to the issues here.

Given that the DOM and CSSOM needs to be constructed before rendering, that results in a big render tree that takes time to construct. It also results in a fair amount of cache bloat since the HTML is unique for every page.
It looks like most of the HTML size can be attributed to the header and site menu, so there might be some opportunity to reduce the size of that component. Since it’s loaded on every page, the performance gains would be magnified site-wide.
Gaps between the same metric across page types
In the case of an e-commerce site like REI, there are numerous templates in use across the site. For example, we have templates for home, category, category details, product details, search, and others.
If we compare the different metrics between page templates, it helps to see the larger picture and prioritize.
| Page Template | TTFB (s) |
|---|---|
| Home | 0.375 |
| Product Details | 0.458 |
| Category | 0.361 |
| Category Details | 1.191 |
| Search | 0.741 |
As you can see from the data, the TTFB for the home, category, and product details are fairly close, meaning that the backend takes a similar amount of time to generate those pages, or they receive enough traffic to be cached on the CDN.
What’s more concerning are the search and category details templates relative to the others. The fact that they are >300ms and 800ms slower than the home page respectively tells me that it’s something that needs attention.
In the case of TTFB, it likely means a slow query is used to generate the page, and perhaps indexing could be improved or the query could be optimized.
It might also be able to be improved by additional caching, either with a key/value cache store like Redis, or if a CDN with a primed cache was used to get the content closer to the user.
Gaps between geography
Experience gaps for geography is an indicator of CDN and cache performance. If we take a look at REI, they are headquartered in Washington, but have a brick and mortar presence across the US and ship nationwide.
It’s important for someone in the western US to have a similar experience as someone in the eastern US.
From their response headers, I can tell that REI uses an Akamai CDN. It’s helpful in that case to look at a cache miss that would have to hit the origin, as well as a cache hit served from the CDN.
With a cache miss on the CDN
Taking a look at the product details page again on the first run, here is what we find.
| Location | TTFB (s) |
|---|---|
| Virginia | 0.458 |
| California | 0.205 |
Using this, we can see that the TTFB is 250ms slower in the eastern part of the country.
With a cache hit on the CDN
If we take a look at the third run of the same test and compare the results, those responses should be in the CDN cache.
| Location | TTFB (s) |
|---|---|
| Virginia | 0.253 |
| California | 0.185 |
The cached version of the page served from the CDN resulted in a similar experience, but the cache miss test was quite different. What might be beneficial is looking at ways to improve the cache hit rate, such as a serverless worker that runs on the edge to crawl the sitemap to help prime the cache.
Waterfall gaps
Taking a look at the gaps in the waterfall is a good indicator of content discoverability. If your HTML comes in and the LCP image isn’t discovered until resource 50, that’s going to slow things down quite a bit.
Looking at the gap between the HTML and the LCP element discovery can be helpful in pinpointing issues with a late LCP, especially when the LCP element is a video or image.
For a site like REI, the LCP image at resource 16 isn’t terrible, but there is room for improvement if they were to reorder the assets in their <head> as mentioned before. This could potentially bump the image discovery up even earlier so it isn’t competing for bandwidth with other assets. However, this will only help if the issues with the A/B testing are cleaned up, as the image completes downloading before the tests have finished running.
A different image format would also help here, as the one on the test page is non-progressive JPEG. If they used the <picture> tag with a modern format like AVIF, the file size of the LCP image would be reduced by about 75%.
Typical problems with client-side frameworks
A lot of sites that use modern front-end frameworks such as Vue or React have problems with a really late LCP because they render too much on the client.
As an example, I did an audit of a popular video game console’s site that is built with React, and their LCP image on the home page was resource #235 in the waterfall. It happened to be this late because they rendered everything on the client.
Although REI uses Vue, the LCP image on this page is in the page HTML and not injected by Vue. It’s not lazyloaded, it’s not a CSS background image, and it’s preloaded with a resource hint in the <head>. These are all good things.
Conclusion
This isn’t an exhaustive list of all the types of gaps we can look at. There are many others such as gaps in device profiles (mobile vs. tablet vs. desktop), device gaps between a flagship phone vs. a mid-tier device, or gaps between when a resource is discovered vs. when it is usable.
All of these gaps can help prioritize performance efforts, identify issues, and inform decisions.